


[ad_1]
The week began cautiously due to concerns ahead of the 2024 US elections, followed by a brief mid-week recovery after the results. However, the gains could not hold, leading the benchmark indices, Nifty and Sensex, to close lower at 24,148 and 79,486, respectively.
Shares of Trent Ltd., the Tata Group stock, extended losses for the fifth consecutive session, ending as top loser on the Nifty 50 index. The stock is down 25% from its peak of ₹8,345. The sharp fall in the stock price was seen after its September quarter results, which were marginally short of elevated expectations.
Going ahead, the Street will now focus on domestic factors including the key macroeconomic data, foreign fund flows and the final phase of the Q2 earnings season. India is set to release CPI and IIP data on November 12, with WPI data expected on November 14.
On the global front, the US inflation report on November 13 will be critical, as it may influence the Federal Reserve’s upcoming policy stance. Additionally, investors will track developments in China’s economic stimulus package.
Earnings reactions will be seen from shares of Tata Motors Ltd., Life Insurance Corporation of Inda, among others that reported results after market hours on Friday.
ONGC, Britannia Industries, Hindalco Industries, Bajaj Consumer Care, Balrampur Chini Mills, Bank Of India, BEML, BLS International Services, Blue Dart Express, Gujarat Narmada Valley Fertilizers & Chemicals, Godfrey Phillips India, and Jubilant FoodWorks will be reporting results on November 11.
FII and DII data
Foreign institutions continued to remain net sellers in the cash market on Friday, while domestic institutions were net buyers yet again.
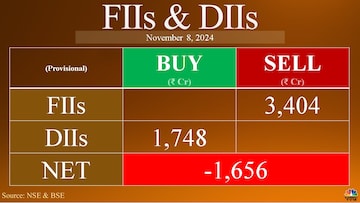
VK Vijayakumar of Geojit Financial attributed the weakness in the Indian market to the relentless selling by FIIs. After the massive FII selling of ₹1.13 lakh crore in October, FIIs have so far, in November, sold equity for ₹19,849 crore in the cash market.
“The rationale for the FII selling is, the elevated valuations in India, which appear conspicuous in the context of the earnings deceleration evident in the Q2 numbers,” he said, adding that the FII selling trend is likely to continue in the near-term till data indicate the possibility of a trend reversal.
What are experts saying?
Markets are expected to remain sideways on the back of mixed global factors and subdued quarterly results.
However, there could be stock specific action on account the last leg of second-quarter earnings to be announced next week, according to Siddhartha Khemka of Motilal Oswal.
What do the Nifty 50 charts suggest?
The Nifty remains in a consolidation range between 24,000-24,500, with mixed signals indicating that this phase may continue.
A clear breakout above the 24,500 level could drive the index toward 24,800, whereas a breakdown might increase pressure, potentially pushing it down to the 200-day exponential moving average (DEMA) near 23,500, said Ajit Mishra – SVP, Research at Religare Broking.
Nagaraj Shetti of HDFC Securities said that a long negative candle was formed on the daily chart after the upside bounce of the last two sessions. The crucial overhead resistance of 24,500 remained intact and the market was not able to sustain above the resistance area.
“Though, technically this candle pattern not showing any signs of bigger decline from here, but some more consolidation or minor dip is expected towards 23,800 or slightly lows,” Shetti said.
The short-term trend remains dicey with short-term volatility in the market. Until Nifty surpasses above 24,500 levels, meaningful upside rally is not expected. At the lows, the Nifty could find support at around 23,800 levels.
Rupak De of LKP Securities expects 24,000 level to serve as strong support for the index. If it holds above this level, Nifty bulls may still have an opportunity to regain momentum. However, a break below 24,000 could further weaken the market.
“The RSI indicator remains in a positive crossover, indicating that short-term momentum is likely to stay strong. In the near term, the index may recover toward 24,500, but a dip below 24,000 could lead to a market correction,” De said.
What do the Nifty Bank charts suggest?
The Nifty Bank index tumbled 355 points to settled at 51,561 on Friday.
According to Santosh Meena of Swastika Investmart, Bank Nifty is relatively stronger but is trading within a range. The 52,500 level acts as a significant resistance, while the 51,000-50,500 zone provides key support.
Meena said that a decisive break above 52,500 could trigger a short-covering rally, with potential targets at 53,300 and 54,000. On the downside, the 200-DMA at 49,500 serves as an important support.
Palka Arora Chopra of Master Capital Services said that Bank Nifty ended the week flat, facing strong resistance in the 52,500-52,600 range. The index is trading within a 2,000-point range, with buying seen around 50,500 and selling at 52,500. It’s now expected to move toward the lower end of this range.
“Immediate resistance is at 51,800, which could push the index back up to 52,500. On the downside, if Bank Nifty breaks below 51,300, it may fall further to 50,800. It gave closing below the 21-day EMA, a ‘sell on rise’ approach is advised for the coming week to stay aligned with the current trend,” the analyst added.
[ad_2]
Source link